Can a small model improve beyond the noise?
A small model can move up a leaderboard because it learned more, because its size is rewarded, or because it was measured differently. GoLLeM-v5 begins by separating those effects.
The report describes a family of 16M–128M decoder-only language models built for the Glint Tiny-ML Leaderboard. Its main reference is a 64M model with an efficiency score of 75.81. The strongest model the authors could measure under the same protocol, GPT-X2-125M, scores 78.26: a gap of about 2.4 points.
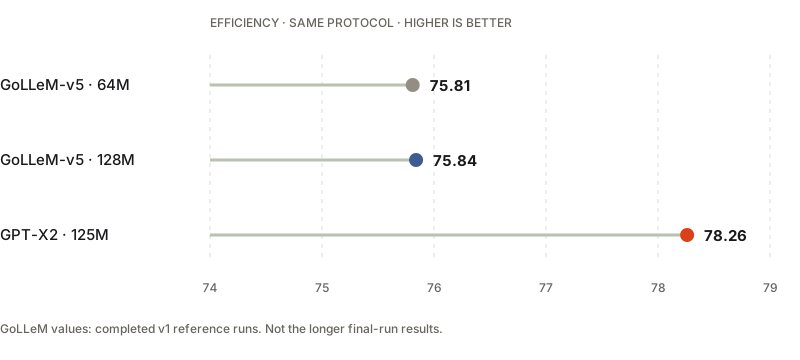
The useful question is where that gap comes from. In the report’s comparison, ARC-Easy accounts for more than half, with BLiMP next. This points toward specific weaknesses to investigate rather than treating the combined score as a diagnosis.
What was already known—and what needed testing.
The report starts from the Glint Tiny-ML benchmark and its reference evaluation script. The authors use GPT-X2-125M as the strongest comparator they could measure under the same protocol. Model-card descriptions suggest larger vocabularies, larger token budgets and different data mixtures as possible explanations; those differences do not establish causality.
DataDecide motivates testing data choices from scratch at small scale. Its reported advantage for educational data is not assumed to transfer to ARC-MIX, which already contains educational and question–answer material. The GoLLeM study therefore compares against its own existing mixture.
The architecture combines established components—RMSNorm, RoPE, SwiGLU, QK normalisation and value residuals—with Muon and AdamW. The contribution examined here is the measured campaign and its decision process, rather than a claim that these components are new.
Prior-art context as described in the source report: §3.1 ↗, §6.5 ↗ and §8.2–8.3 ↗. This is the report’s context, not an independent literature review.
State what would be enough to replace the baseline.
The 64M flagship is the campaign’s reference model, but each controlled experiment has its own matched baseline. A candidate must satisfy its full pre-written rule. Failing that rule leaves the baseline in place; it does not prove the candidate can never help.
| Question / baseline | Required evidence to replace it |
|---|---|
| Z1 data hypothesis: 32M ARC-MIX arm C at 4.915B tokens | FineWeb-Edu must gain more than 2 ARC points with the paired interval excluding zero, improve efficiency, lose at most 1.0 BLiMP point and worsen byte perplexity by at most 0.05. |
| Final corpus choice: keep ARC-MIX | Compare mean Z-seed efficiency with C on selection data. Change the corpus only when the gap exceeds max(0.6, 2 × absolute seed difference); otherwise retain ARC-MIX. |
| H4 shape: standard 32M Z recipe, mean of two seeds | Deep-narrow shape must gain at least max(1.0, 2 × absolute BLiMP seed difference), lose at most 1.0 ARC point and improve efficiency. |
The operational claim is that a proposed change clears its adoption rule at this size and budget. A tie or failed constraint rejects adoption in this experiment, not the broader research direction.
Write down the score and the decision rule.
Let A and B be ARC-Easy and BLiMP accuracy in percent, w WikiText byte perplexity, and p the declared parameter count. With the report’s fixed constants:
m(p) = 1 + 0.5 · clip[0,1](ln(150M / p) / ln(150M / 1K))
eff = (A + B + W(w)) · m(p) / 3
Here clip restricts a value to [0, 1], M denotes a million parameters and K a thousand. For a decision based on seed differences, the threshold is τ = max(floor, 2|Δseeds|). The floor and additional per-axis conditions belong to the specific experiment above.
§2.1, equations 4–7 ↗; §5.3, noise floors ↗.
The benchmark combines grammatical preference on BLiMP, question answering on ARC-Easy, and language modelling on WikiText-2. The WikiText byte perplexity is converted to a score; the mean of the three is multiplied by a factor that rewards smaller models.
At the report’s fixed leaderboard revision, the size multipliers are 1.0365 for the 64M reference and 1.0084 for the 128M reference. Doubling size must earn back roughly 2.1 efficiency points through better predictions.
| Model | ARC-Easy ↑ | BLiMP ↑ | Byte perplexity ↓ | Efficiency ↑ |
|---|---|---|---|---|
| 64M v1 | 47.94% | 75.83% | 2.3718 | 75.81 |
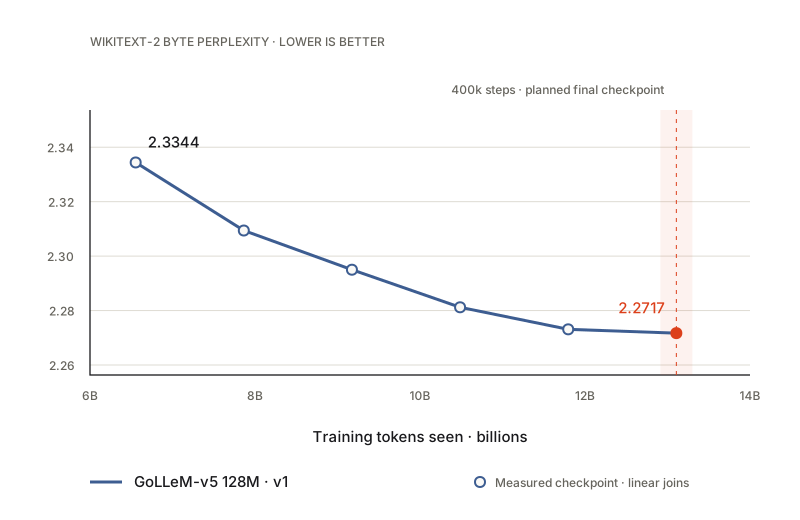
| 128M v1 | 51.94% | 77.26% | 2.2717 | 75.84 |
The larger model improves every raw metric, yet the final combined scores are essentially tied. That conclusion applies to this recipe and token budget.
Why evaluation details change the answer
The canonical BLiMP evaluation uses 67,000 sentence pairs and omits the first token from each sentence’s likelihood. ARC-Easy uses 2,376 test questions, bare-question prompts and answer likelihood without length normalisation. WikiText uses 256-token prediction windows without carried context. The tokenizer’s measured 3.8605 bytes per token is needed for the perplexity conversion.
The report documents a wrong bytes-per-token constant and an earlier BLiMP protocol mismatch in the authors’ own submission. These are measurement errors, not training improvements. §9.3 ↗
The efficiency formula uses the leaderboard’s extremes at the source revision. A different leaderboard revision can change the normalisation; these are historical paper values.
Separate selection, training and reporting.
Each comparison starts with a written decision rule: which metric must improve, by how much, which regressions are allowed, and what to do if the evidence is inconclusive. Selection data and reporting tests have different jobs.
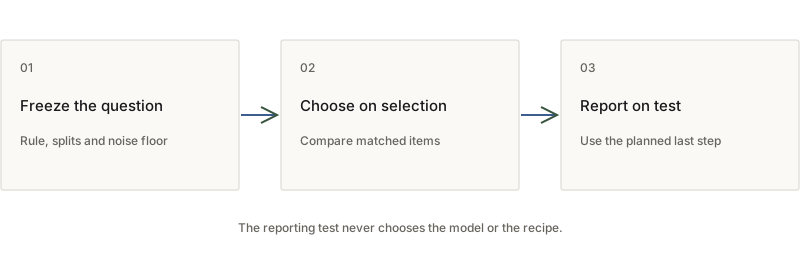
Paired bootstrap intervals compare the same questions, sentence pairs or text windows in both arms. Those intervals capture evaluation noise. Seed pairs provide a separate, limited estimate of training variation. Because one seed pair is weak evidence, rules also use a minimum decision threshold, often 0.6 efficiency points.
The planned last checkpoint supplies the reported result. Intermediate improvements and confidence intervals do not override the pre-written decision rule.
Training and data implementation
The reference architecture uses RMSNorm, rotary positions, SwiGLU, QK normalisation, value residuals and tied embeddings. Its byte-level BPE vocabulary has 12,288 tokens and its training context is 1,024 tokens. Muon handles hidden matrix weights; AdamW handles embeddings and other parameters.
Fix the sampler
The earlier trainer sampled windows with replacement and could replay early windows after resume. The r6 epoch sampler visits each window once per epoch and makes the sequence a function of seed and step, enabling exact resume.
Inspect the actual corpus
The final pool removes documents matched by the specified benchmark-overlap scans and documents carrying the targeted non-commercial license marker. It contains 9,391,706,576 tokens after both passes.
The paper is explicit about limits: the full semantic scan was unfinished for some experimental pools, and the license-marker rule does not cover every spelling. “Scanned against specified sets, with matching documents removed” is more accurate than claiming complete decontamination.
Sources: §3, architecture and trainer ↗; §4, data ↗; Appendix B, scan limitations ↗.
Change one lever in a matched comparison.
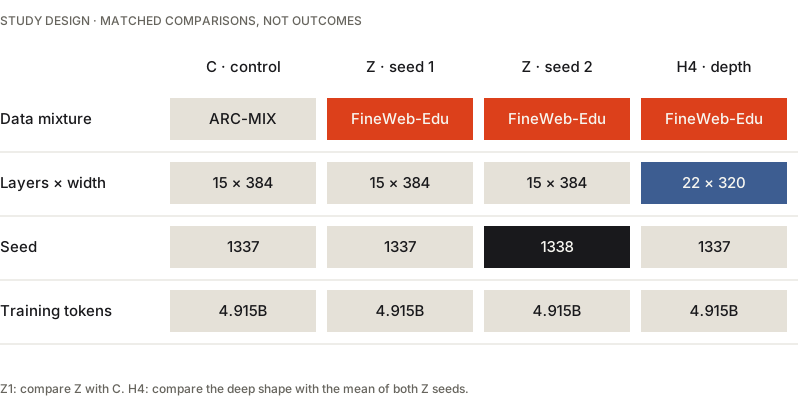
View the experiment grid above ↑
The campaign asks several distinct questions rather than treating all runs as one leaderboard sweep. Late-data branches start from the same 64M checkpoint at step 320,000 and finish at 400,000. The continuation study starts from the completed flagship and uses a warmup–stable–decay schedule.
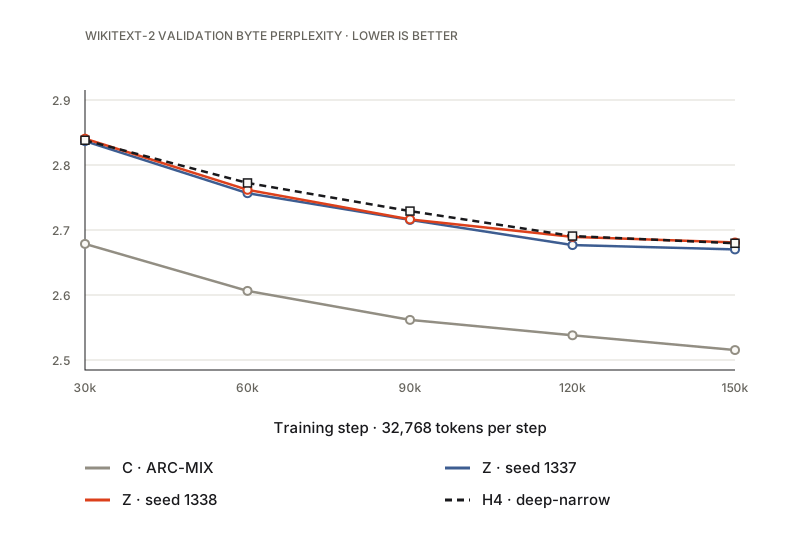
Z1 moves the data intervention to the first training step: 32M models run for 150,000 steps, or 4.915B tokens, with two FineWeb-Edu seeds and one ARC-MIX control. H4 compares a 22 × 320 deep-narrow shape against the mean of the standard 15 × 384 Z runs at the final step.
Selection questions found in any compared pool are excluded before comparison. Evaluation uses the frozen selection axis; the canonical reporting test does not choose the recipe. Because the experiments differ in budgets, data, shapes and axes, their differences must be interpreted within each design.
Designs: §6.2 ↗, §6.4–6.5 ↗ and §6.6 ↗. Outcomes appear in Result below.
Which questions remain open?
The paper’s final-run setup keeps the reference shapes and mixture, uses the corrected sampler and cleaner pool, and extends each run to 760,000 steps: 24.90B tokens. The 64M shape is 14 layers × 576 width; the 128M shape is 16 × 768.
Those longer runs were still in progress in version 3. Their intermediate trajectories cannot establish the final ranking: the cosine schedules differ from the earlier runs, and much of the improvement may arrive during decay. This web edition does not turn the paper’s expected completion dates into verified outcomes.
A larger tokenizer, question–answer data from the start, and distillation from a larger teacher remain untested here. The companion proposal explores a different lever: using low-noise control losses to decide which data shards deserve training compute.
Sources: §7, final-run setup and status ↗; §8, open levers and limitations ↗.
Check the evidence before accepting the conclusion.
The report checks its harness against an independent maintainer measurement: ARC-Easy 47.94, token perplexity 28.05, and byte perplexity about 2.372 with 3.8605 bytes per token. BLiMP requires a scope distinction: the canonical 67,000-pair set gives 75.83, while the maintainer’s 73,000-pair set gives 75.99.
- Measurement: recompute the score from raw axes and the pinned normalisation; do not mix different BLiMP sets or perplexity conversions.
- Decision: compare paired items, account separately for seed variation, apply every threshold and report the planned final checkpoint.
- Execution: verify model parameter counts, trainer and pool hashes, checkpoint upload hashes and resume behaviour. Two independent builds of the final pool produced the same hash.
- Limits: a single seed pair is a weak noise estimate; some full semantic scans were incomplete; initial submission and sampler errors are disclosed.
These are checks and limitations reported by the paper. This web adaptation does not independently rerun the training or the benchmark.
The tested changes did not displace the baseline.
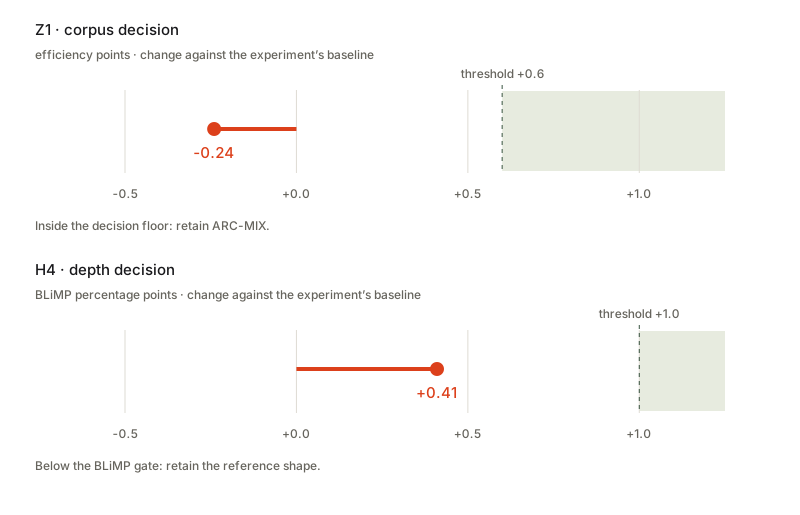
The campaign tested plausible changes to data, size and architecture. None cleared its decision rule for an efficiency improvement. The negative results are specific to the tested sizes, budgets, baselines and training stages.
| Change | Setting | Reported outcome |
|---|---|---|
| FineWeb-Edu in the cosine tail | 64M · last 20% | Tie; +0.11 eff versus doubled QA at the last step |
| Double model size | 64M → 128M | +0.03 eff; quality gains offset by size penalty |
| Continue on a new mixture | 64M · WSD segments | Second segment −0.24 eff; interval [−0.68, +0.20] |
| FineWeb-Edu from scratch | 32M · 4.9B tokens | Corpus decision −0.24 eff; within the 0.6 floor |
| Deeper, narrower shape | 32M · matched budget | BLiMP +0.41; below the required +1.0 |
Late data swaps changed scores by less than the measured noise. Training from scratch on FineWeb-Edu produced roughly one extra ARC point over the existing mixture, but worse WikiText performance and no overall win. The deeper model’s small BLiMP gain did not meet its threshold and came with lower throughput.
These experiments do not show that educational data or depth are ineffective in general. They show that the tested changes did not justify replacing this baseline. The stricter FineWeb-Edu filter (Z4) still had a pending verdict in this paper edition.
The completed 64M and 128M v1 references score 75.81 and 75.84. No tested lever justified a new final-run recipe under its decision rule. The longer 24.90B-token runs and the Z4 verdict were still pending in the pinned edition; they have no final result here.
Return to the evidence.
This web edition is an editorial adaptation of Arkadiusz Słota’s paper, not an additional experiment or a replacement for the original. Diagrams were redrawn for the web; quantitative values are taken from the cited sections.
- Original paper · version 3
- GoLLeM-v5: measurement, method and negative results · PDF ↗
- Repository record
- Version, author, status, license and acknowledgements ↗
Source revision:cbb0ab90cf2005dcabb75dbf2e9b412b38d6b1a8
PDF SHA-256:f4010e2ee50ab5e32fabdbbac33cce3c9be5816e5e95124e8e56afb1aa159fb2 - Contributions
- Paper by Arkadiusz Słota with support from the Kolektyw AI agents: Latarnik, Hart, Monter and Wartownik. The PDF describes their individual roles. Web adaptation by Fabryka AI.
- License
- The source metadata states “not decided”. Publication here does not grant a new license to the underlying paper.